East Indians under PNC and PPP Government of Guyana.
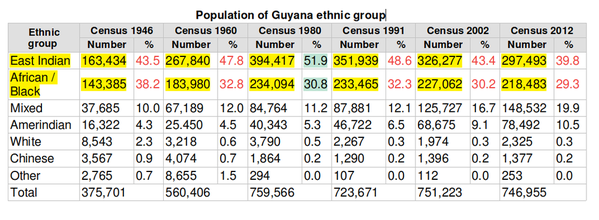
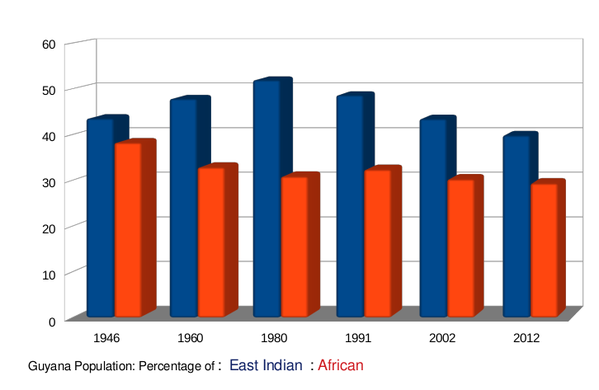
It’s interesting from observation of data of the population of East Indians in Guyana,from 1960 to 1980, the population increased from 47.8 percent to a peek of 51.9 percent. Those were tough years of oppression and economic decline under the PNC started around 1970 .From 1980 the population decrease to 48.6 percent in 1991.From 1992 the PPP came to power, the population decrease further reaching 39.8 percent in 2012.There is a possibility to date, the population further decreased.
The strange phenomenon, the population grows up to 1980 and the decrease to date.


